

#
Liquidation heatmaps explained
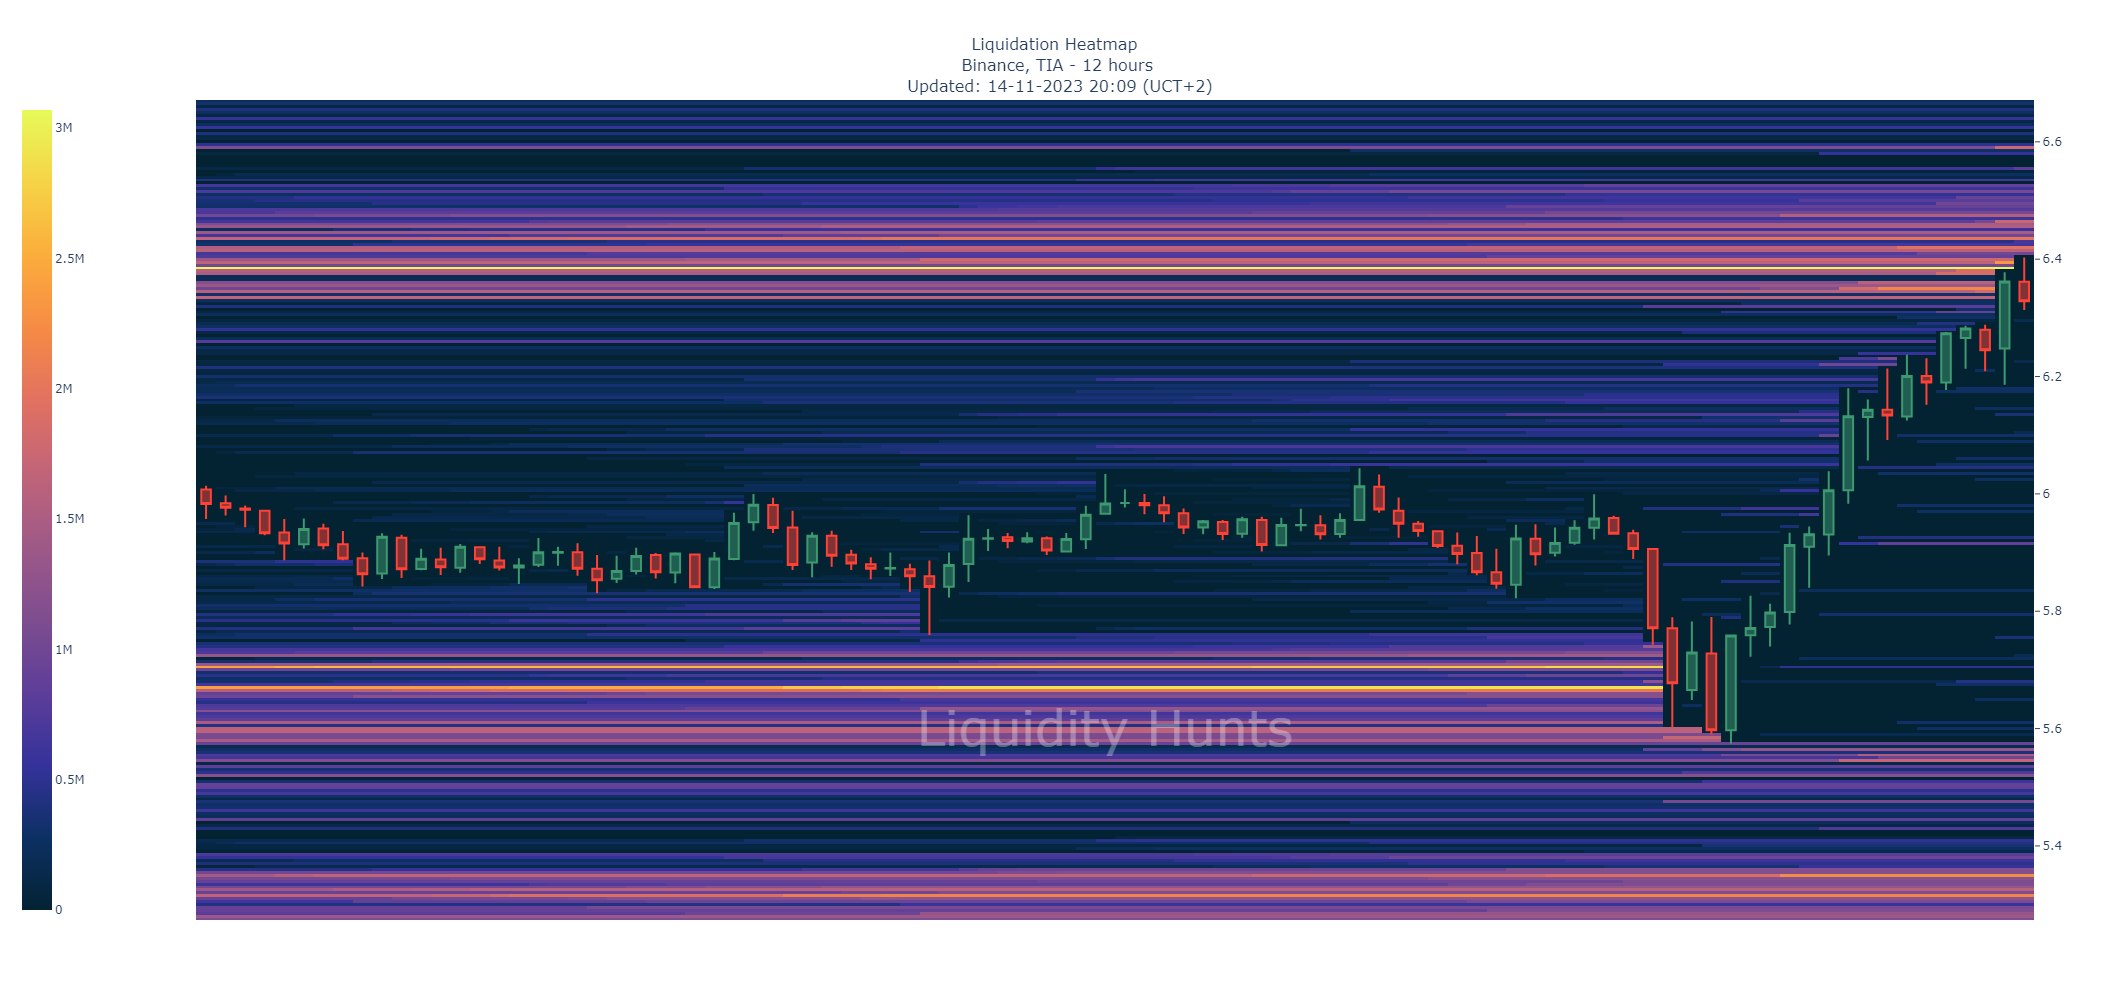
A liquidation heatmap (figure 1) is a visual representation of the liquidation levels of traders in a market. It is calculated using market data and different leverage amounts. The liquidation levels are then added to price buckets on a chart. The more liquidation levels are added to a certain price, the brighter the color of the heatmap becomes, with bright yellow representing the highest amount of predicted liquidation levels. This allows traders to identify areas of high liquidity and potential price volatility.
In other words, a liquidation heatmap is a tool that helps traders identify where other traders are most likely to be liquidated. This can be useful for both long and short traders, as it can help them to avoid being liquidated themselves and to identify potential trading opportunities.
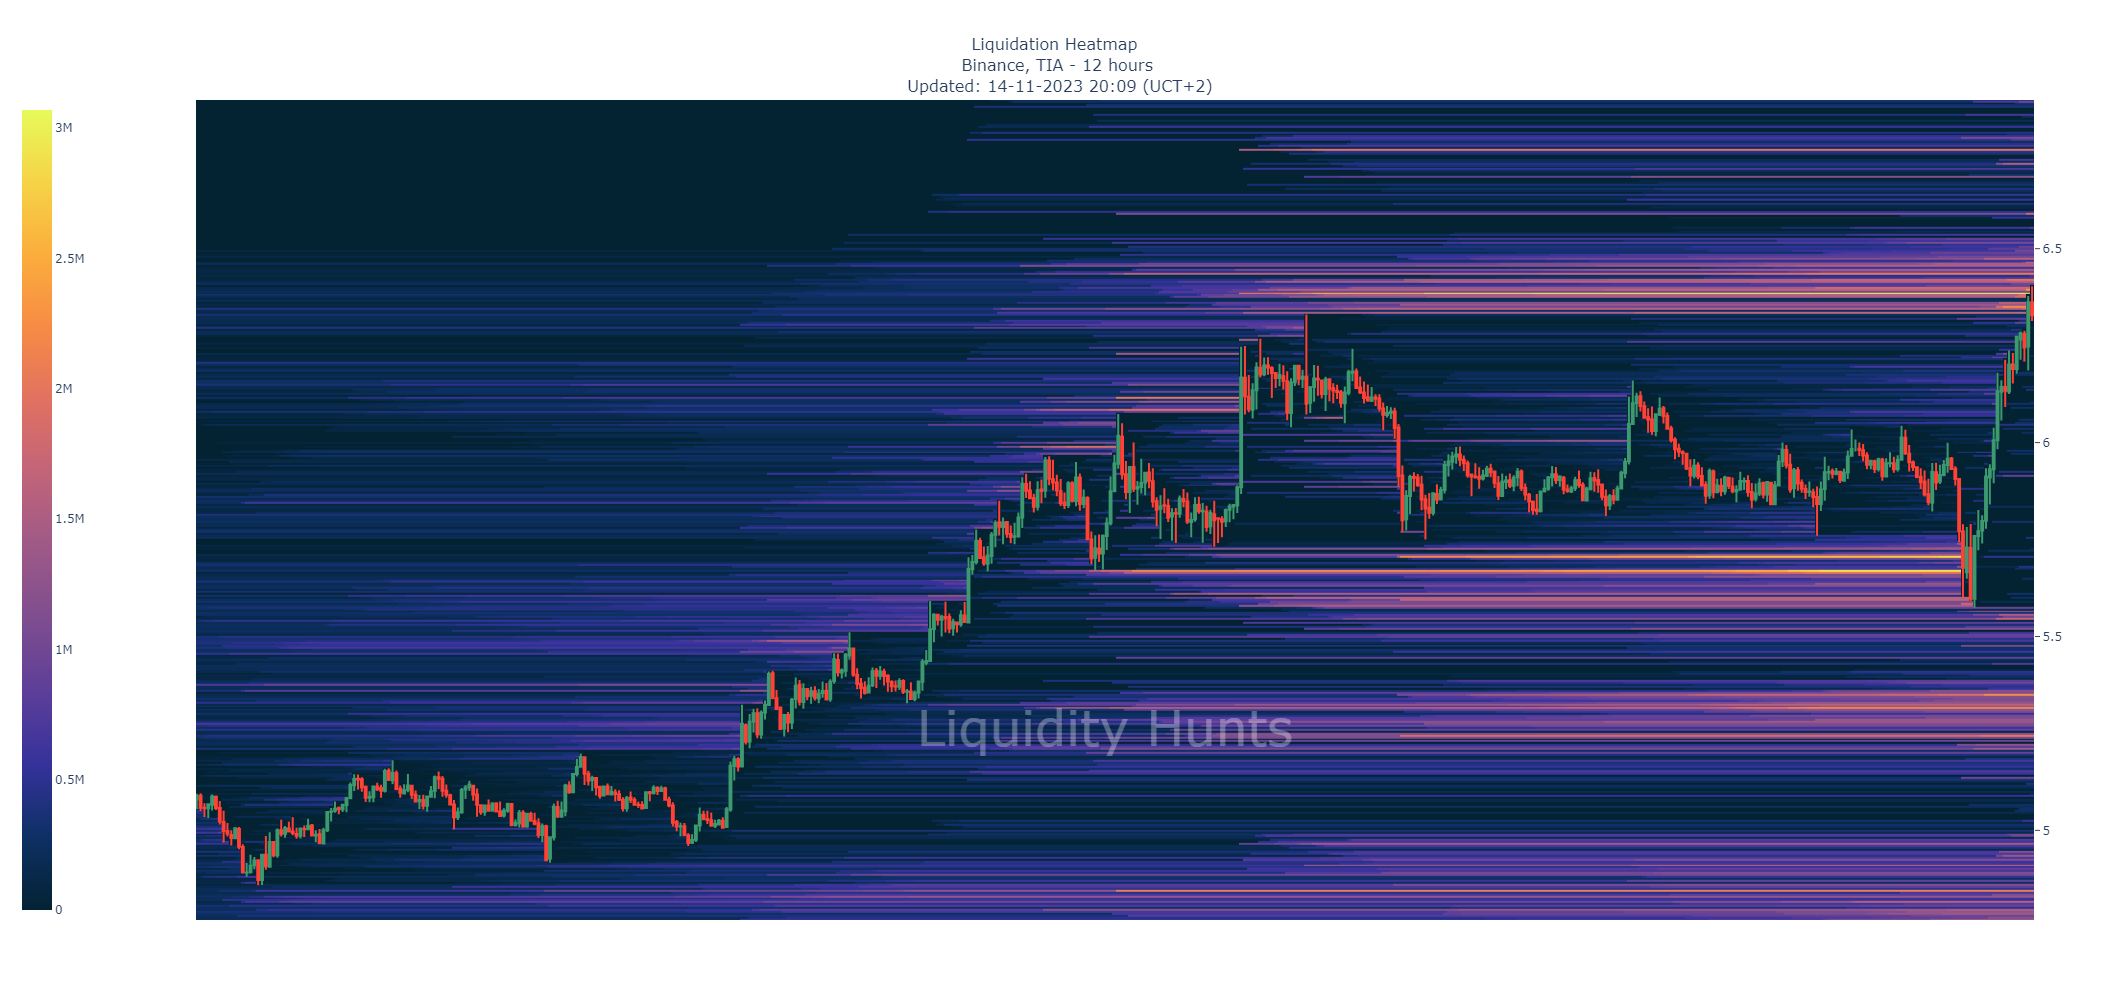
Price is likely to move towards a brighter zone of liquidations. If the liquidation zone is above the price as in figure 1 (see below) traders can expect the price to go towards that zone and could look for a long and take profit at that zone. Shorters could look at the liquidation zone and choose to take a short. In figure 2 it is visible that price immediately reversed after the liquidity was taken at the bright yellow zone.
We also have heatmaps for stocks like SP500, Google, Nvidia, Tesla and Amazon. In the video below you can find an example of the SP500 heatmaps at 3:33.